
When you're building an application powered by AI, "it mostly works" isn't good enough. You need to understand how it fails, when it fails, and why. Now I Get It! uses Claude to transform scientific PDFs into interactive web pages, and while the results are generally strong, some pages have issues -- inaccurate explanations, missing key information, structural problems, rendering glitches. The question is: how do you go from "some pages have problems" to "here are the specific failure modes, ranked by frequency, that our evals need to catch"?
The answer is open coding -- a qualitative research method where you systematically review outputs, tag them with categories, and let patterns emerge from the data. It's the bridge between anecdotal quality impressions and rigorous, automated evaluation.
The Review Workflow
The operations dashboard now has a "Job Review" section. Enter a job ID -- or click "Review" from any job row in the existing drill-down tables -- and the dashboard loads the job's metadata alongside a live iframe preview of the generated page. Below the preview sits a review form: thumbs up or down, category checkboxes (Not accurate, Missing key information, Poorly structured, Page errors, Design issues), and a free-text comment field for anything the categories don't capture.
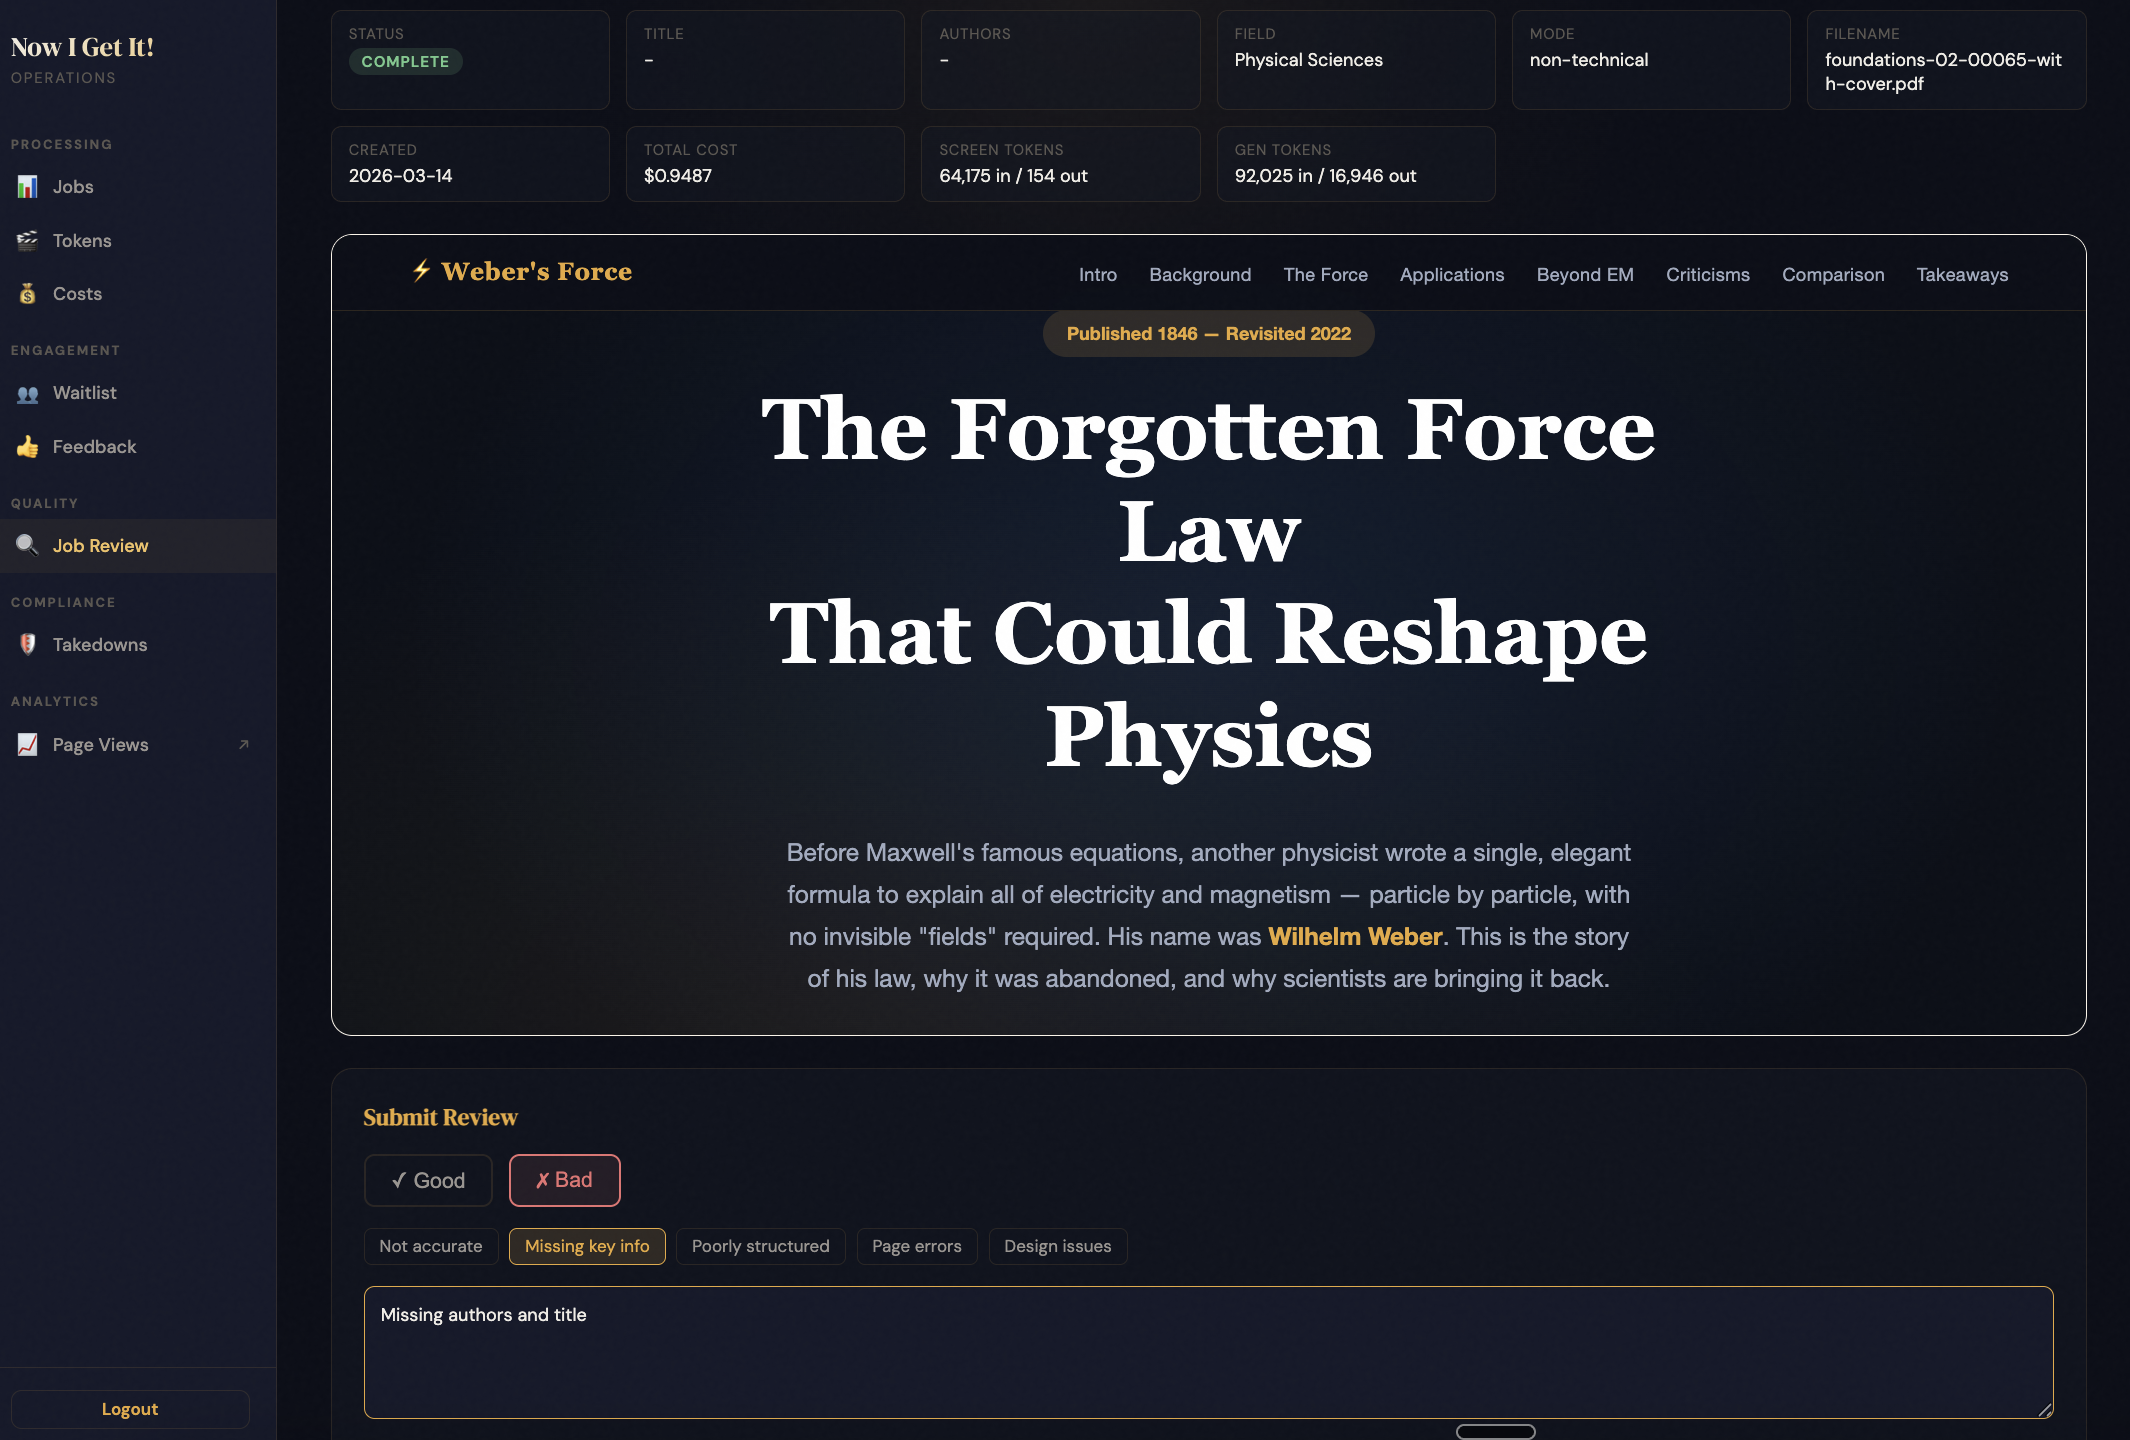
Every review is stored and displayed in a history panel, so I can see the full annotation trail for any page. Over time, these annotations will reveal which failure modes are most common -- and that's exactly the data I need to design targeted evals.
The Iframe Problem
The trickiest part was embedding generated pages inside the dashboard. CloudFront's security headers blocked all iframe embedding -- X-Frame-Options: DENY and frame-src 'none' -- which is the right default for a public site. But the admin dashboard lives on the same origin as the generated pages, so loosening to SAMEORIGIN and frame-src 'self' was safe. Third-party sites still can't frame Now I Get It! content.
Keeping the Data Clean
Admin reviews and public user feedback both live in the same DynamoDB table. A new feedback_source field distinguishes them -- "admin" for reviews, "user" for public feedback. The dashboard's feedback analytics filter out admin records so they don't inflate the user satisfaction metrics. It would have been easier to create a separate table, but sharing the table means I can eventually query across both sources to correlate admin quality assessments with user sentiment on the same pages.
Why This Matters
Building evals for AI applications is one of the hardest problems in the space right now. Most teams jump straight to automated metrics -- BLEU scores, factual accuracy checks, LLM-as-judge -- without first understanding their specific failure modes. Open coding is the unglamorous first step: look at a lot of outputs, write down what's wrong, and let the categories crystallize from real data rather than assumptions. The tooling I built today makes that process efficient enough to actually do it consistently.